SpringCloud alibaba微服务实战番外四 - 搭建ELK环境并集成日志
概述
在单体服务中我们需要查看日志只需直接在日志文件中 grep、awk 就可以获得自己想要的信息。
但是在微服务架构中,不同的服务模块一般会部署多个节点,日志散落在多个节点的日志文件中。一旦出现问题,我们就需要登录不同的服务节点分别查看日志,非常之繁琐。所以在微服务架构中,我们是需要建立集中式日志收集系统,将所有节点上的日志统一收集,管理,访问。
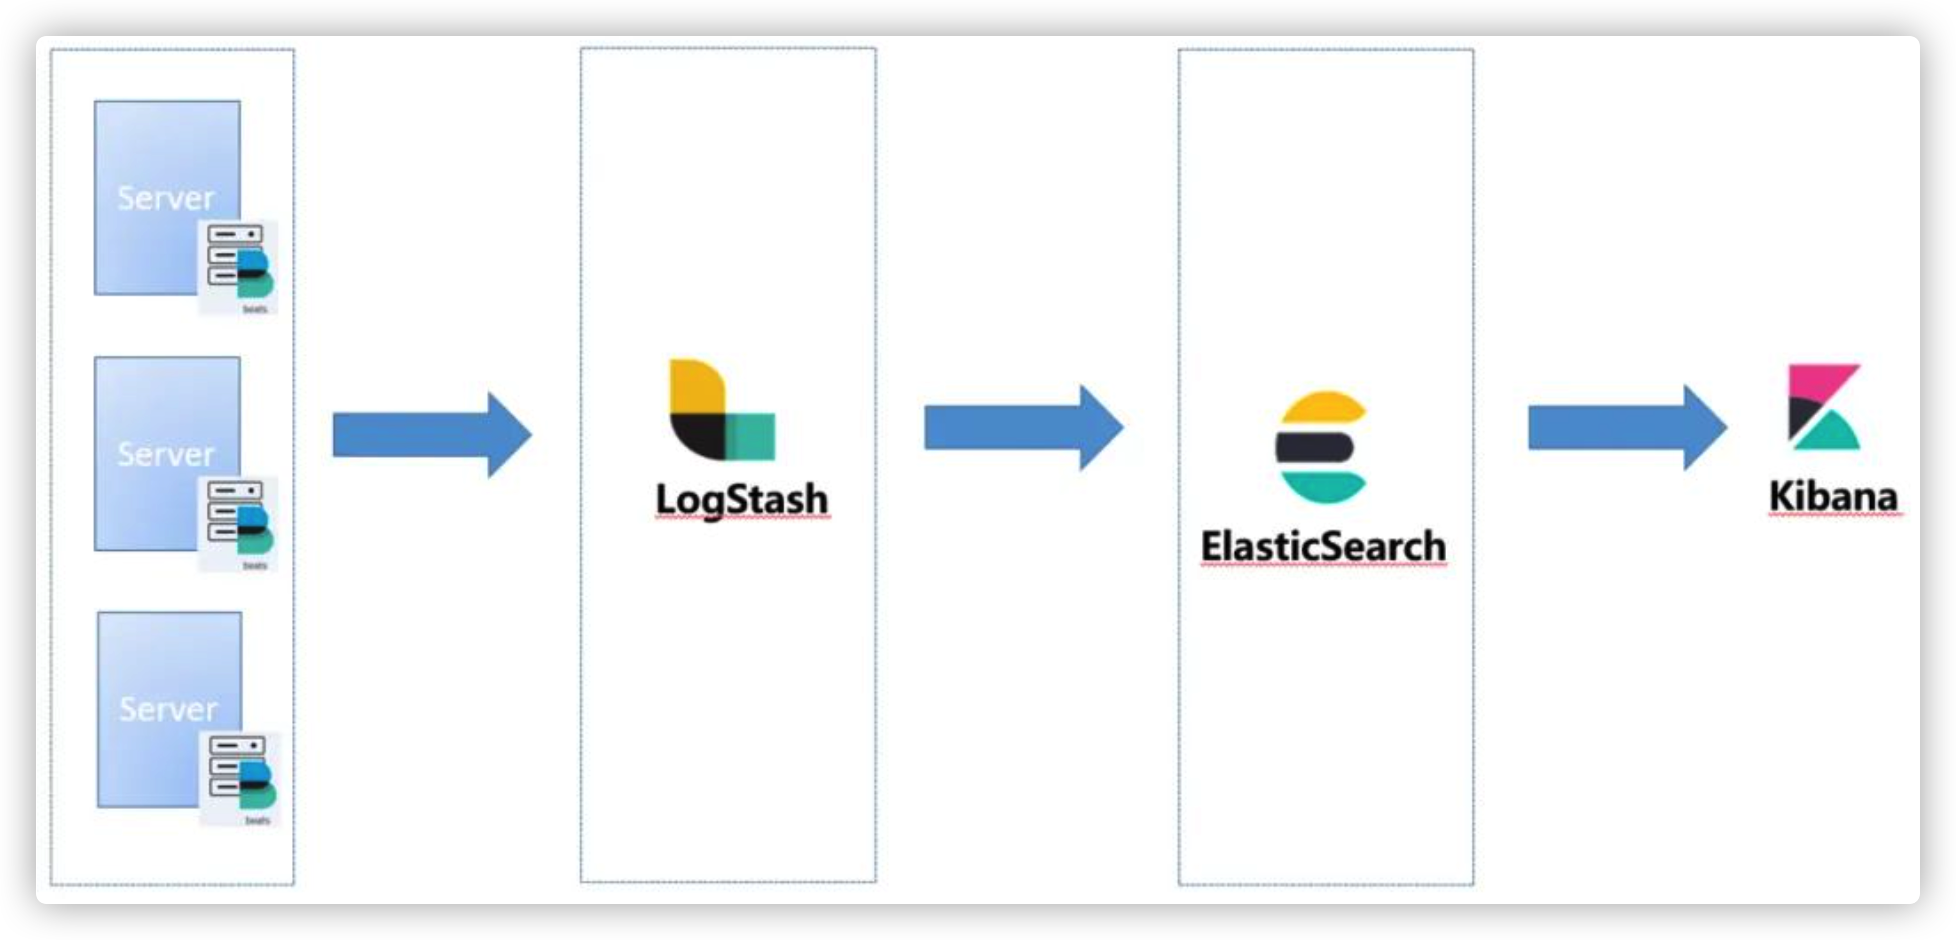
现在目前主流的分布式日志解决方案还是基于ELK(ElasticSearch、Logstash、Kibana),今天我们就动手搭建一个单机版的ELK日志收集系统并将我们的日志文件集成进去。
ELK版本:7.13.4
ElasticSearch 安装配置
说明:ElasticSearch7.13.4内置了JDK16,如果没有特殊要求,直接使用默认JDK即可。本文中直接使用ElasticSearch的默认JDK16。
- 下载
下载地址:https://artifacts.elastic.co/downloads/elasticsearch/elasticsearch-7.13.4-linux-x86_64.tar.gz
- 上传文件并解压缩
将下载下来的ElasticSearch上传至服务器目录/app/elasticsearch,并将其解压
cd /app/elasticsearch
tar -zxvf elasticsearch-7.13.4-linux-x86_64.tar.gz
解压完成后的目录结构如下:
ll
total 319484
drwxr-xr-x 9 elastic elastic      4096 Jul 15 02:37 elasticsearch-7.13.4
-rw-r--r-- 1 root root 327143992 Aug 3 14:26 elasticsearch-7.13.4-linux-x86_64.tar.gz- 创建ElasticSearch启动用户
ElasticSearch不允许使用root用户启动,所以我们需要创建一个elastic用户用于启动ElasticSearch,并授予用户对应权限。
useradd elastic
chown -R elastic:elastic /app/elasticsearch/- 修改es配置
配置文件为:/app/elasticsearch/elasticsearch-7.13.4/config/elasticsearch.yml
关键配置:
cluster.name: elk-application
node.name: node-1
network.host: 0.0.0.0
http.port: 9200
discovery.seed_hosts: ["127.0.0.1"]
cluster.initial_master_nodes: ["node-1"]- 修改es的JVM参数
配置文件为:/app/elasticsearch/elasticsearch-7.13.4/config/jvm.options
配置内容:
-Xms4g
-Xmx4g- 修改系统配置文件
- 在
/etc/sysctl.conf中增加如下配置
vm.max_map_count = 655360- 在
/etc/security/limits.conf后面增加如下配置
*    	soft    memlock   unlimited
*     hard    memlock   unlimited
*     hard    nofile    65536
*     soft    nofile    65536
修改完成后需要使用命令 sysctl -p 重新加载配置。
- 切换elastic用户并启动ElasticSearch
su - elastic
cd /app/elasticsearch/elasticsearch-7.13.4/bin
./elasticsearch  # 正常启动,可以看到启动日志
或者 ./elasticsearch -d # 后台启动,看不到启动日志- 验证安装
在服务器执行curl 127.0.0.1:9200命令,查看输出结果,如果输出如下json数据,则表示启动成功。
{
  "name" : "node-1",
  "cluster_name" : "elk-application",
  "cluster_uuid" : "qvggIOwbTk6pVlxFlulqQg",
  "version" : {
    "number" : "7.13.4",
    "build_flavor" : "default",
    "build_type" : "tar",
    "build_hash" : "c5f60e894ca0c61cdbae4f5a686d9f08bcefc942",
    "build_date" : "2021-07-14T18:33:36.673943207Z",
    "build_snapshot" : false,
    "lucene_version" : "8.8.2",
    "minimum_wire_compatibility_version" : "6.8.0",
    "minimum_index_compatibility_version" : "6.0.0-beta1"
  },
  "tagline" : "You Know, for Search"
}
如果你服务器已经安装好了JDK环境并且想使用自己的JDK,可以修改配置
/app/elasticsearch/elasticsearch-7.13.4/bin中的elasticsearch-env。在配置ES_CLASSPATH=”$ES_HOME/lib/*”之后加入
ES_JAVA_HOME=/app/elasticsearch/elasticsearch-7.13.4/jdk # 修改为你自己的jdk地址
Kibana 安装配置
- 下载
下载地址:https://artifacts.elastic.co/downloads/kibana/kibana-7.13.4-linux-x86_64.tar.gz
- 上传文件并解压缩
将下载下来的Kibana上传至服务器目录/app/Kibana,并将其解压
cd /app/kibana
tar -zxvf kibana-7.13.4-linux-x86_64.tar.gz- 修改配置文件
/kibana/kibana-7.13.4-linux-x86_64/config/kibana.yml
# 端口
server.port: 5601
# 指定本机ip让外部能访问
server.host: "0.0.0.0"
# 请求数据指向的elasticsearch服务器
elasticsearch.hosts: ["http://ip:9200"]
# 中文汉化
i18n.locale: "zh-CN"
这几个配置在配置文件中被注释掉了,直接放开注释做相应的修改即可。
- 创建kibana启动用户
Kibana默认情况下也不允许使用root用户启动,你可以选择在启动命令后加上--allow-root参数,不过为了规范,我们还是创建一个独立用户用于启动Kibana,并授予用户对应权限。
useradd kibana
chown -R kibana:elastic /app/kibana/- 切换用户并使用启动kibana
su - kibana # 切换用户
./kibana
或者 ./kibana &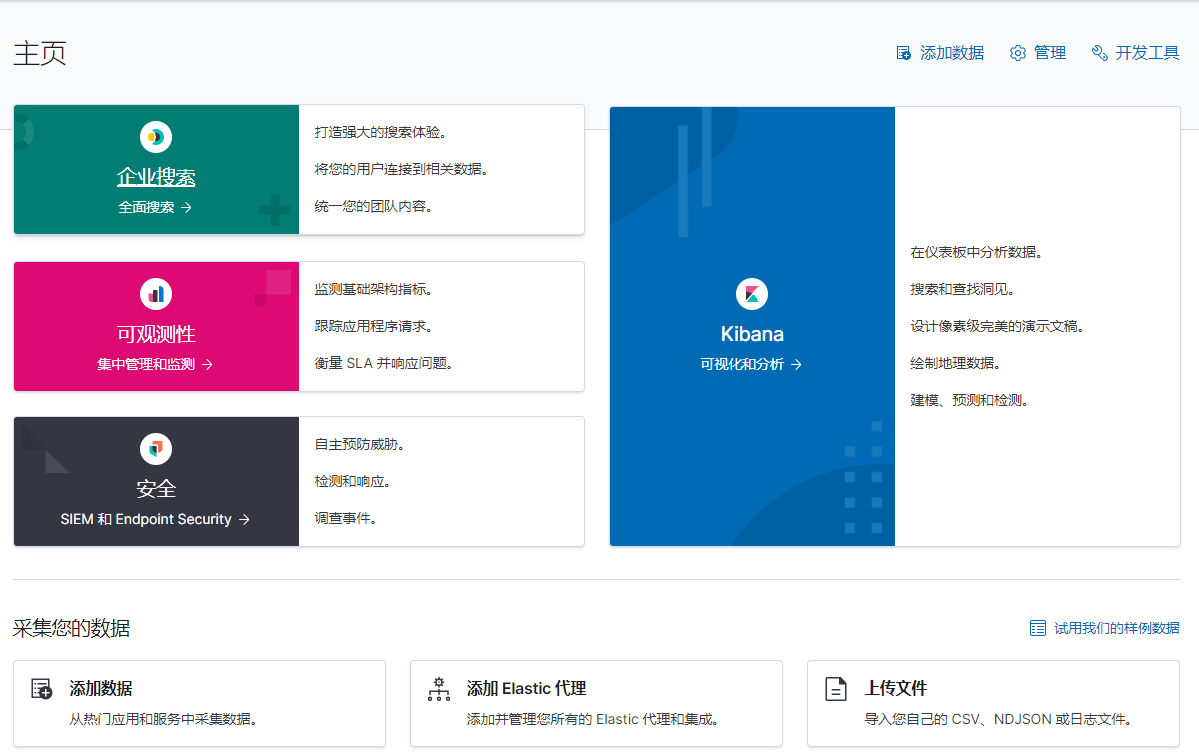
或者 ./kibana --allow-root # 未设置独立用户,不建议使用- 访问
通过浏览器输入http://ip:5601/即可访问kibana
安全加固
我们刚刚部署的Kibana是不需要密码就可以登录的,这样谁都可以kibana访问并且更改索引数据,在生产环境中为了保证数据的安全,我们必须得给kibana加上密码,保证用户登录后可进行操作。
主要是利用elasticsearch自带的xpack作为权限验证功能。操作步骤如下:
1. 修改ES配置开启 X-PACK
修改ElasticSearch的配置文件,/app/elasticsearch/elasticsearch-7.13.4/config/elasticsearch.yml,开启x-pack
xpack.security.enabled: true
xpack.security.transport.ssl.enabled: true
2. 重启ElasticSearch
./bin/elasticsearch -d
3. 初始化用户密码
cd /app/elasticsearch/elasticsearch-7.13.4/bin
./elasticsearch-setup-passwords interactive
执行后会出现下面的内容,让你设置对应的密码,输入 y 继续
Initiating the setup of passwords for reserved users elastic,apm_system,kibana,kibana_system,logstash_system,beats_system,remote_monitoring_user.
You will be prompted to enter passwords as the process progresses.
Please confirm that you would like to continue [y/N]y

...
Changed password for user [apm_system]
Changed password for user [kibana_system]
Changed password for user [kibana]
Changed password for user [logstash_system]
Changed password for user [beats_system]
Changed password for user [remote_monitoring_user]
Changed password for user [elastic]
4. 设置证书
启用x-pack后ElasticSearch的启动日志会报Caused by: javax.net.ssl.SSLHandshakeException: No available authentication scheme的异常,原因是因为缺少CA证书,所以我们需要给其生成一个。
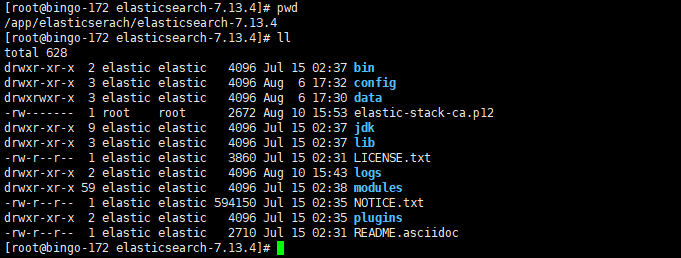
./bin/elasticsearch-certutil ca看到提示后直接回车即可,不用设置密码
If you elect to generate PEM format certificates (the -pem option), then the output will
be a zip file containing individual files for the CA certificate and private key

Please enter the desired output file [elastic-stack-ca.p12]:  # 直接回车
Enter password for elastic-stack-ca.p12 : # 直接回车
之后我们在ElasticSearch的安装目录下会看到这个证书文件elastic-stack-ca.p12
现在我们借助生成的这个证书文件生成p12秘钥
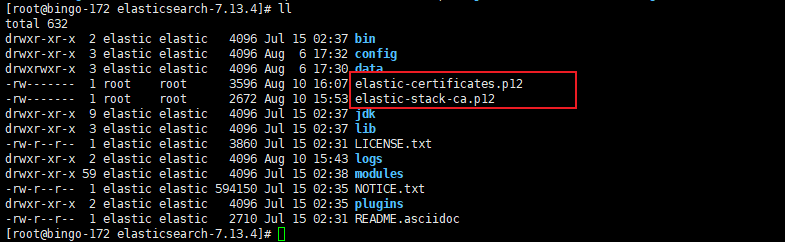
./bin/elasticsearch-certutil cert --ca elastic-stack-ca.p12看到提示后还是直接回车,不设置密码
Enter password for CA (elastic-stack-ca.p12) :  # 直接回车
Please enter the desired output file [elastic-certificates.p12]: # 回车
Enter password for elastic-certificates.p12 : # 回车

# 文件路径
Certificates written to /app/elasticserach/elasticsearch-7.13.4/elastic-certificates.p12
此时文件如下:
在config目录下创建certs目录,并将生成的秘钥文件拷贝进去
mkdir certs
cp ../elastic-certificates.p12 certs/elastic-certificates.p12再次修改ElasticSearch的配置文件elasticsearch.yml中xpack相关配置
xpack.security.enabled: true
xpack.security.transport.ssl.enabled: true
xpack.security.transport.ssl.verification_mode: certificate
xpack.security.transport.ssl.keystore.path: certs/elastic-certificates.p12
xpack.security.transport.ssl.truststore.path: certs/elastic-certificates.p12
接着再次重启ElasticSearch后错误消失。
5. 修改Kibana配置
修改kibana配置文件/app/kibana/kibana-7.13.4-linux-x86_64/config/kibana.yml
elasticsearch.username: "elastic"
elasticsearch.password: "changeMe"
5. 重新启动kibana
6. 验证
使用curl访问ElasticSearch提示需要密码
{
  "error": {
    "root_cause": [
      {
        "type": "security_exception",
        "reason": "missing authentication credentials for REST request [/]",
        "header": {
          "WWW-Authenticate": "Basic realm=\"security\" charset=\"UTF-8\""
        }
      }
    ],
    "type": "security_exception",
    "reason": "missing authentication credentials for REST request [/]",
    "header": {
      "WWW-Authenticate": "Basic realm=\"security\" charset=\"UTF-8\""
    }
  },
  "status": 401
}
带上密码后重新调用,显示正常
curl --user elastic:password http://ip:9200/
{
"name" : "node-1",
"cluster_name" : "efk-application",
"cluster_uuid" : "qvggIOwbTk6pVlxFlulqQg",
"version" : {
"number" : "7.13.4",
"build_flavor" : "default",
"build_type" : "tar",
"build_hash" : "c5f60e894ca0c61cdbae4f5a686d9f08bcefc942",
"build_date" : "2021-07-14T18:33:36.673943207Z",
"build_snapshot" : false,
"lucene_version" : "8.8.2",
"minimum_wire_compatibility_version" : "6.8.0",
"minimum_index_compatibility_version" : "6.0.0-beta1"
},
"tagline" : "You Know, for Search"
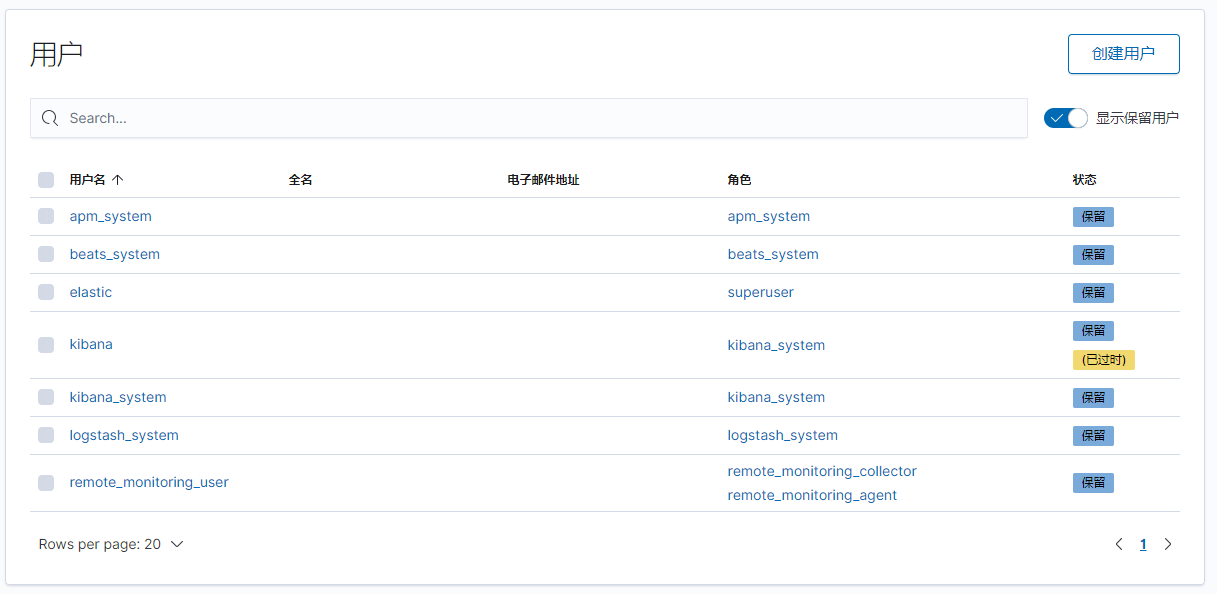
}重新登录kibana需要使用密码,需要使用elastic账户登录
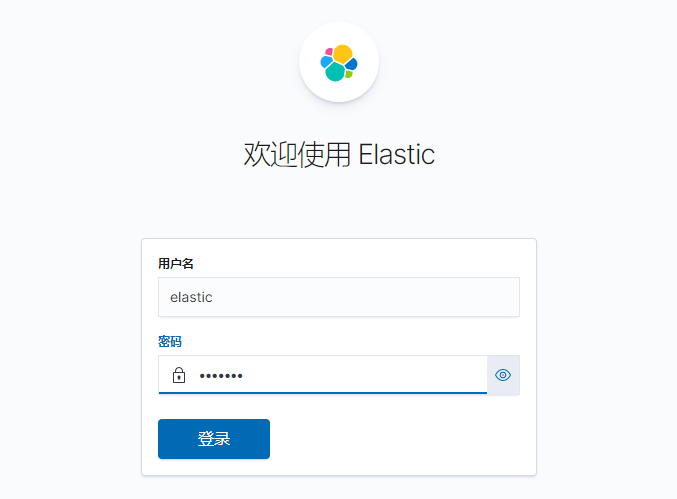
登录后在kibana中可以对用户和角色进行管理。
Logstash安装配置
- 下载
下载地址:https://artifacts.elastic.co/downloads/logstash/logstash-7.13.4-linux-x86_64.tar.gz
- 上传文件并解压缩
将下载下来的logstash上传至服务器目录/app/logstash,并将其解压
cd /app/logstash
tar -zxvf logstash-7.13.4-linux-x86_64.tar.gz- 修改配置文件
在/app/logstash/logstash-7.13.4/config中复制logstash-sample.conf为logstash.conf,并修改里面的内容:
cp logstash-sample.conf logstash.confinput {
beats {
port => 5044
}
}
output {
elasticsearch {
hosts => ["http://ip:9200"]
index => "%{[@metadata][beat]}-%{[@metadata][version]}-%{+YYYY.MM.dd}"
user => "elastic"
password => "password"
}
}主要修改host、user、password的属性值。
- 启动logstash
./logstash -f ../config/logstash.conf 通过上面的安装配置我们已经将ELK环境搭建完毕,接下来需要将日志集成进来。
集成日志
日志接入到ELK有多种形式,最常见的就是使用FileBeat。此时Filebeat扮演日志代理的角色,安装在生成日志文件的计算机上,跟踪它们,并将数据转发到Logstash以进行更高级的处理,或者直接转发到Elasticsearch进行索引。
这种方式实现比较简单,在我 “运维监控” 系列文章中有详细介绍,感兴趣的同学可以移步查看。
今天我们介绍另外一种方式,使用logstash-logback-encoder直接将logback日志推送到logstash。
配置 logstash 输出到 elasticsearch
操作步骤如下:
- 引入logstash插件包
<dependency>
  <groupId>net.logstash.logback</groupId>
  <artifactId>logstash-logback-encoder</artifactId>
  <version>6.6</version>
</dependency>- 修改logback-spring.xml,配置logstash到appender
<?xml version="1.0" encoding="UTF-8"?>
<configuration debug="false">
	<!--定义日志文件的存储地址 -->
	<property name="LOG_HOME" value="./logs" />
	<property name="LOG_NAME" value="cloud_gateway" />

	<springProperty scope="context" name="applicationName" source="spring.application.name"/>
	...
	<!--LogStash-->
	<appender name="logstash" class="net.logstash.logback.appender.LogstashTcpSocketAppender">
    <!--logstash的请求地址-->
		<destination>172.xx.0.xxx:5064</destination>
		<encoder charset="UTF-8" class="net.logstash.logback.encoder.LogstashEncoder">
			<customFields>{"serverName":"${applicationName}"}</customFields>
		</encoder>
	</appender>


	<!-- 日志输出级别 -->
	<root level="INFO">
		...
		<appender-ref ref="logstash"/>
	</root>

</configuration>文件中删除了不相关的配置,值得注意的是这里定义了一个静态常量appllicationName,从配置文件中读取spring.application.name的值,并通过customFields自定义字段serverName传输到了logstash。
- 修改logstash的配置文件,logstash.conf
input {
  tcp {
    port => 5064
    codec => json_lines
    type => "cloud_alibaba"
  }
}

output {
  # 如果不需要打印可以直接删除
  stdout{
    codec => rubydebug
  }

  # 通过type用于区分不同来源的日志
  if [type] == "cloud_alibaba"{
    elasticsearch {
      hosts => ["http://localhost:9200"]
      index => "%{[serverName]}-%{+YYYY.MM.dd}"
      user => "elastic"
      password => "changeMe"
    }
  }
}logstash需要使用tcp协议接受logstash传来的日志,并使用customFields中定义的serverName动态建立索引。
- 重新启动logstash 以及后端服务
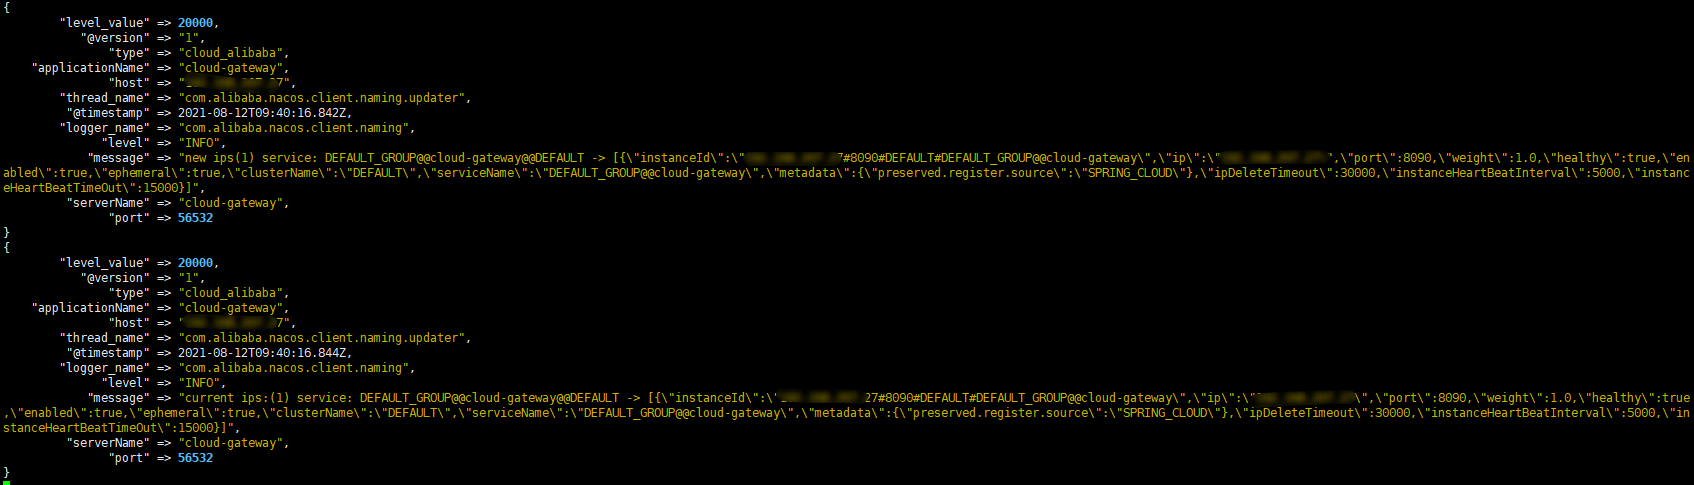
通过logstash的启动面板可以看到日志已经传输到了ElasticSearch,并且已经使用cloud-gateway作为索引名。
kibana操作
日志传输到ElasticSearch后我们就需要借助kibana将日志展示出来。
首先我们需要登录kibana,创建索引模式
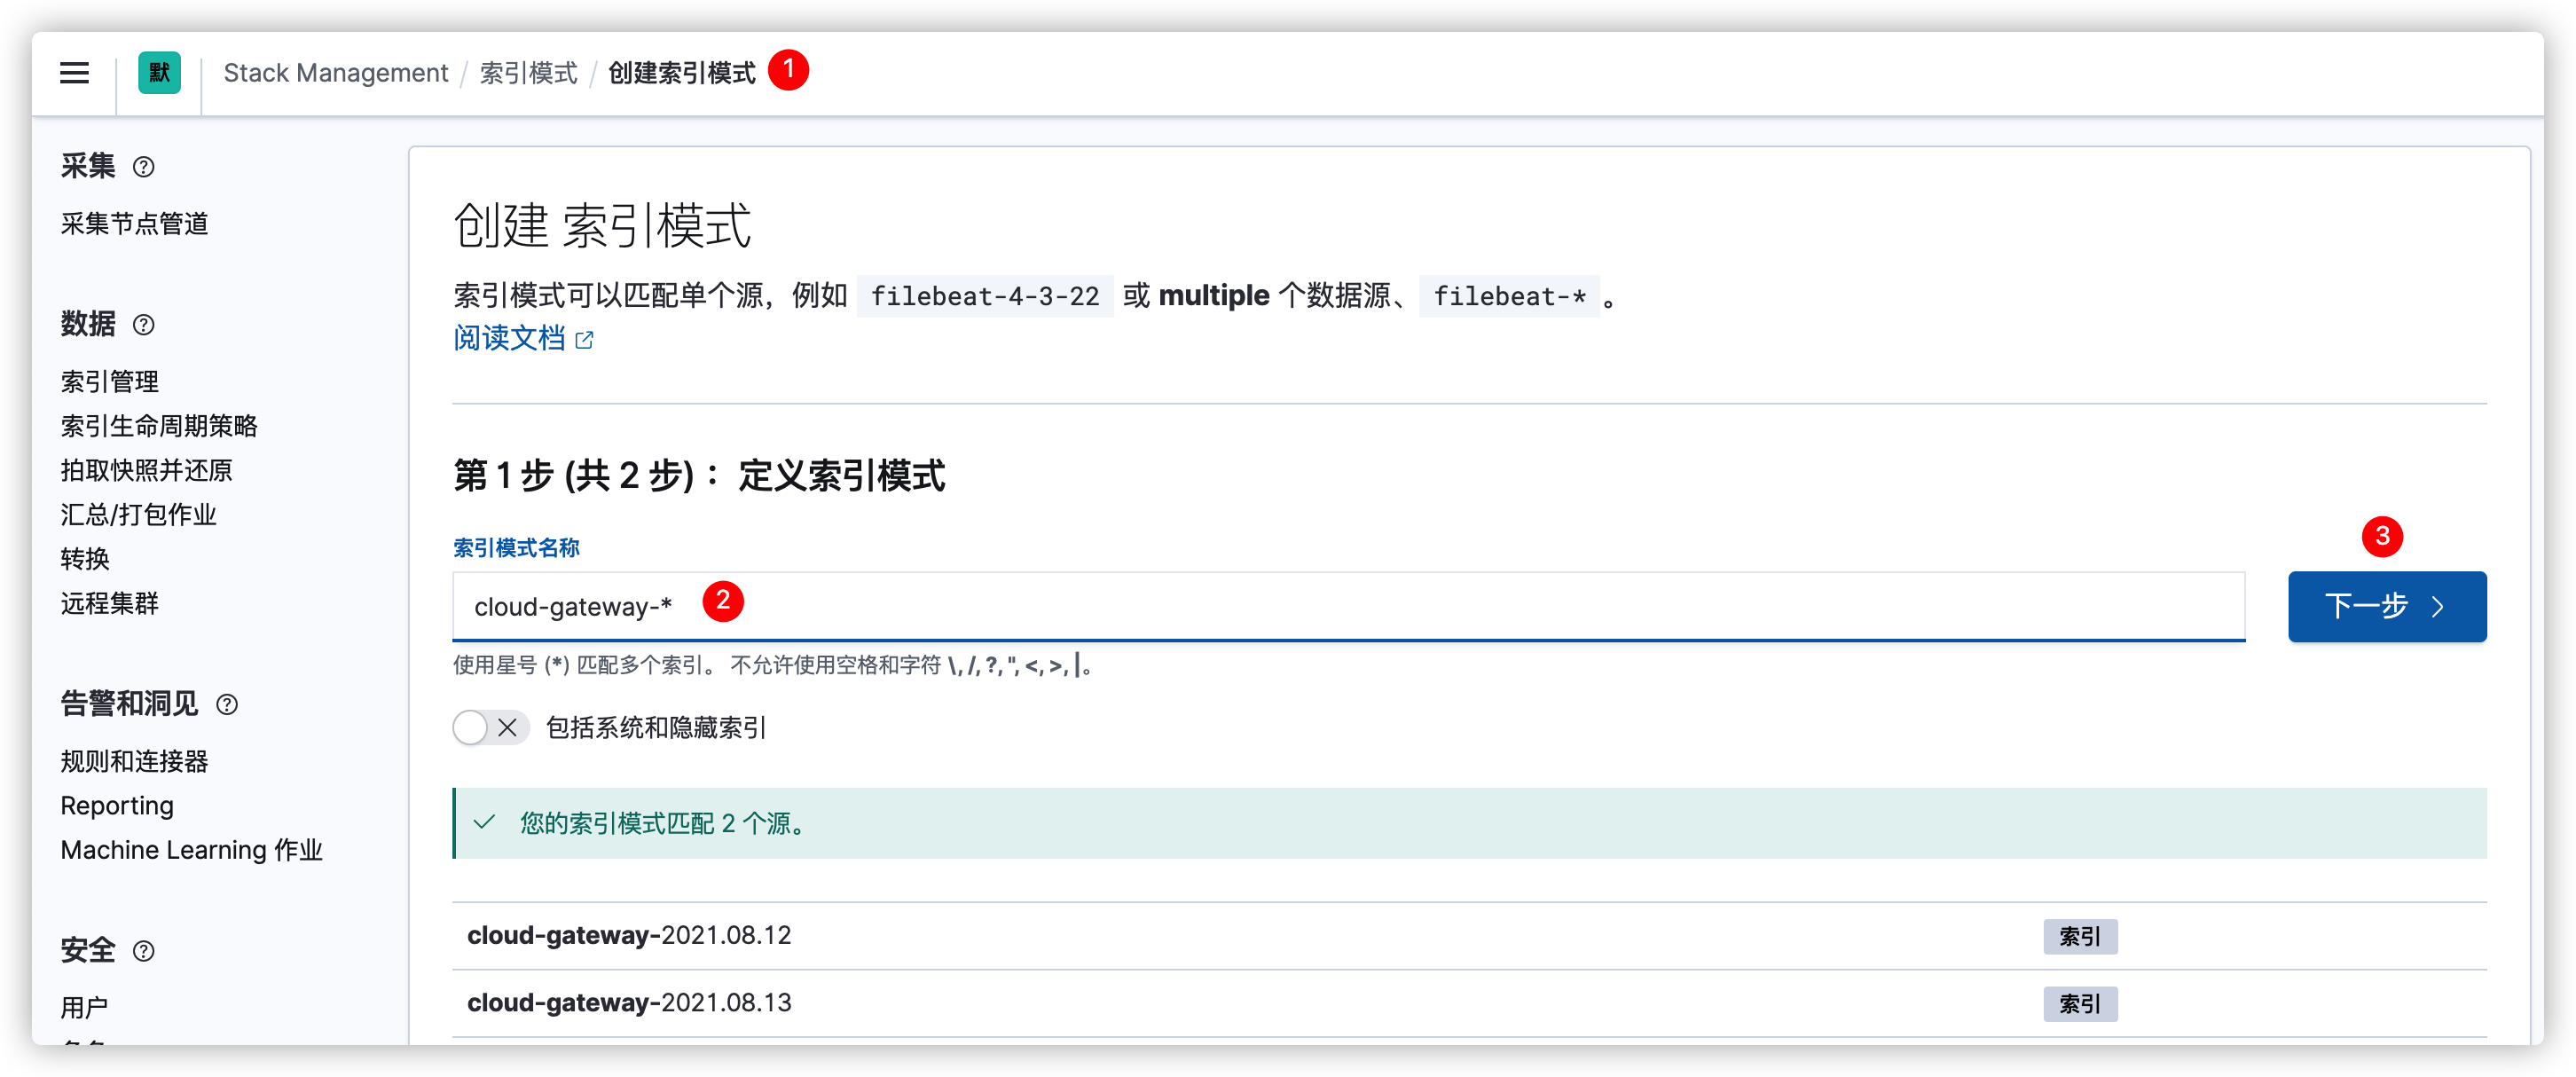
使用cloud-gateway-*作为索引名称,然后点下一步并保存。
然后就可以在Discover中查看日志了。
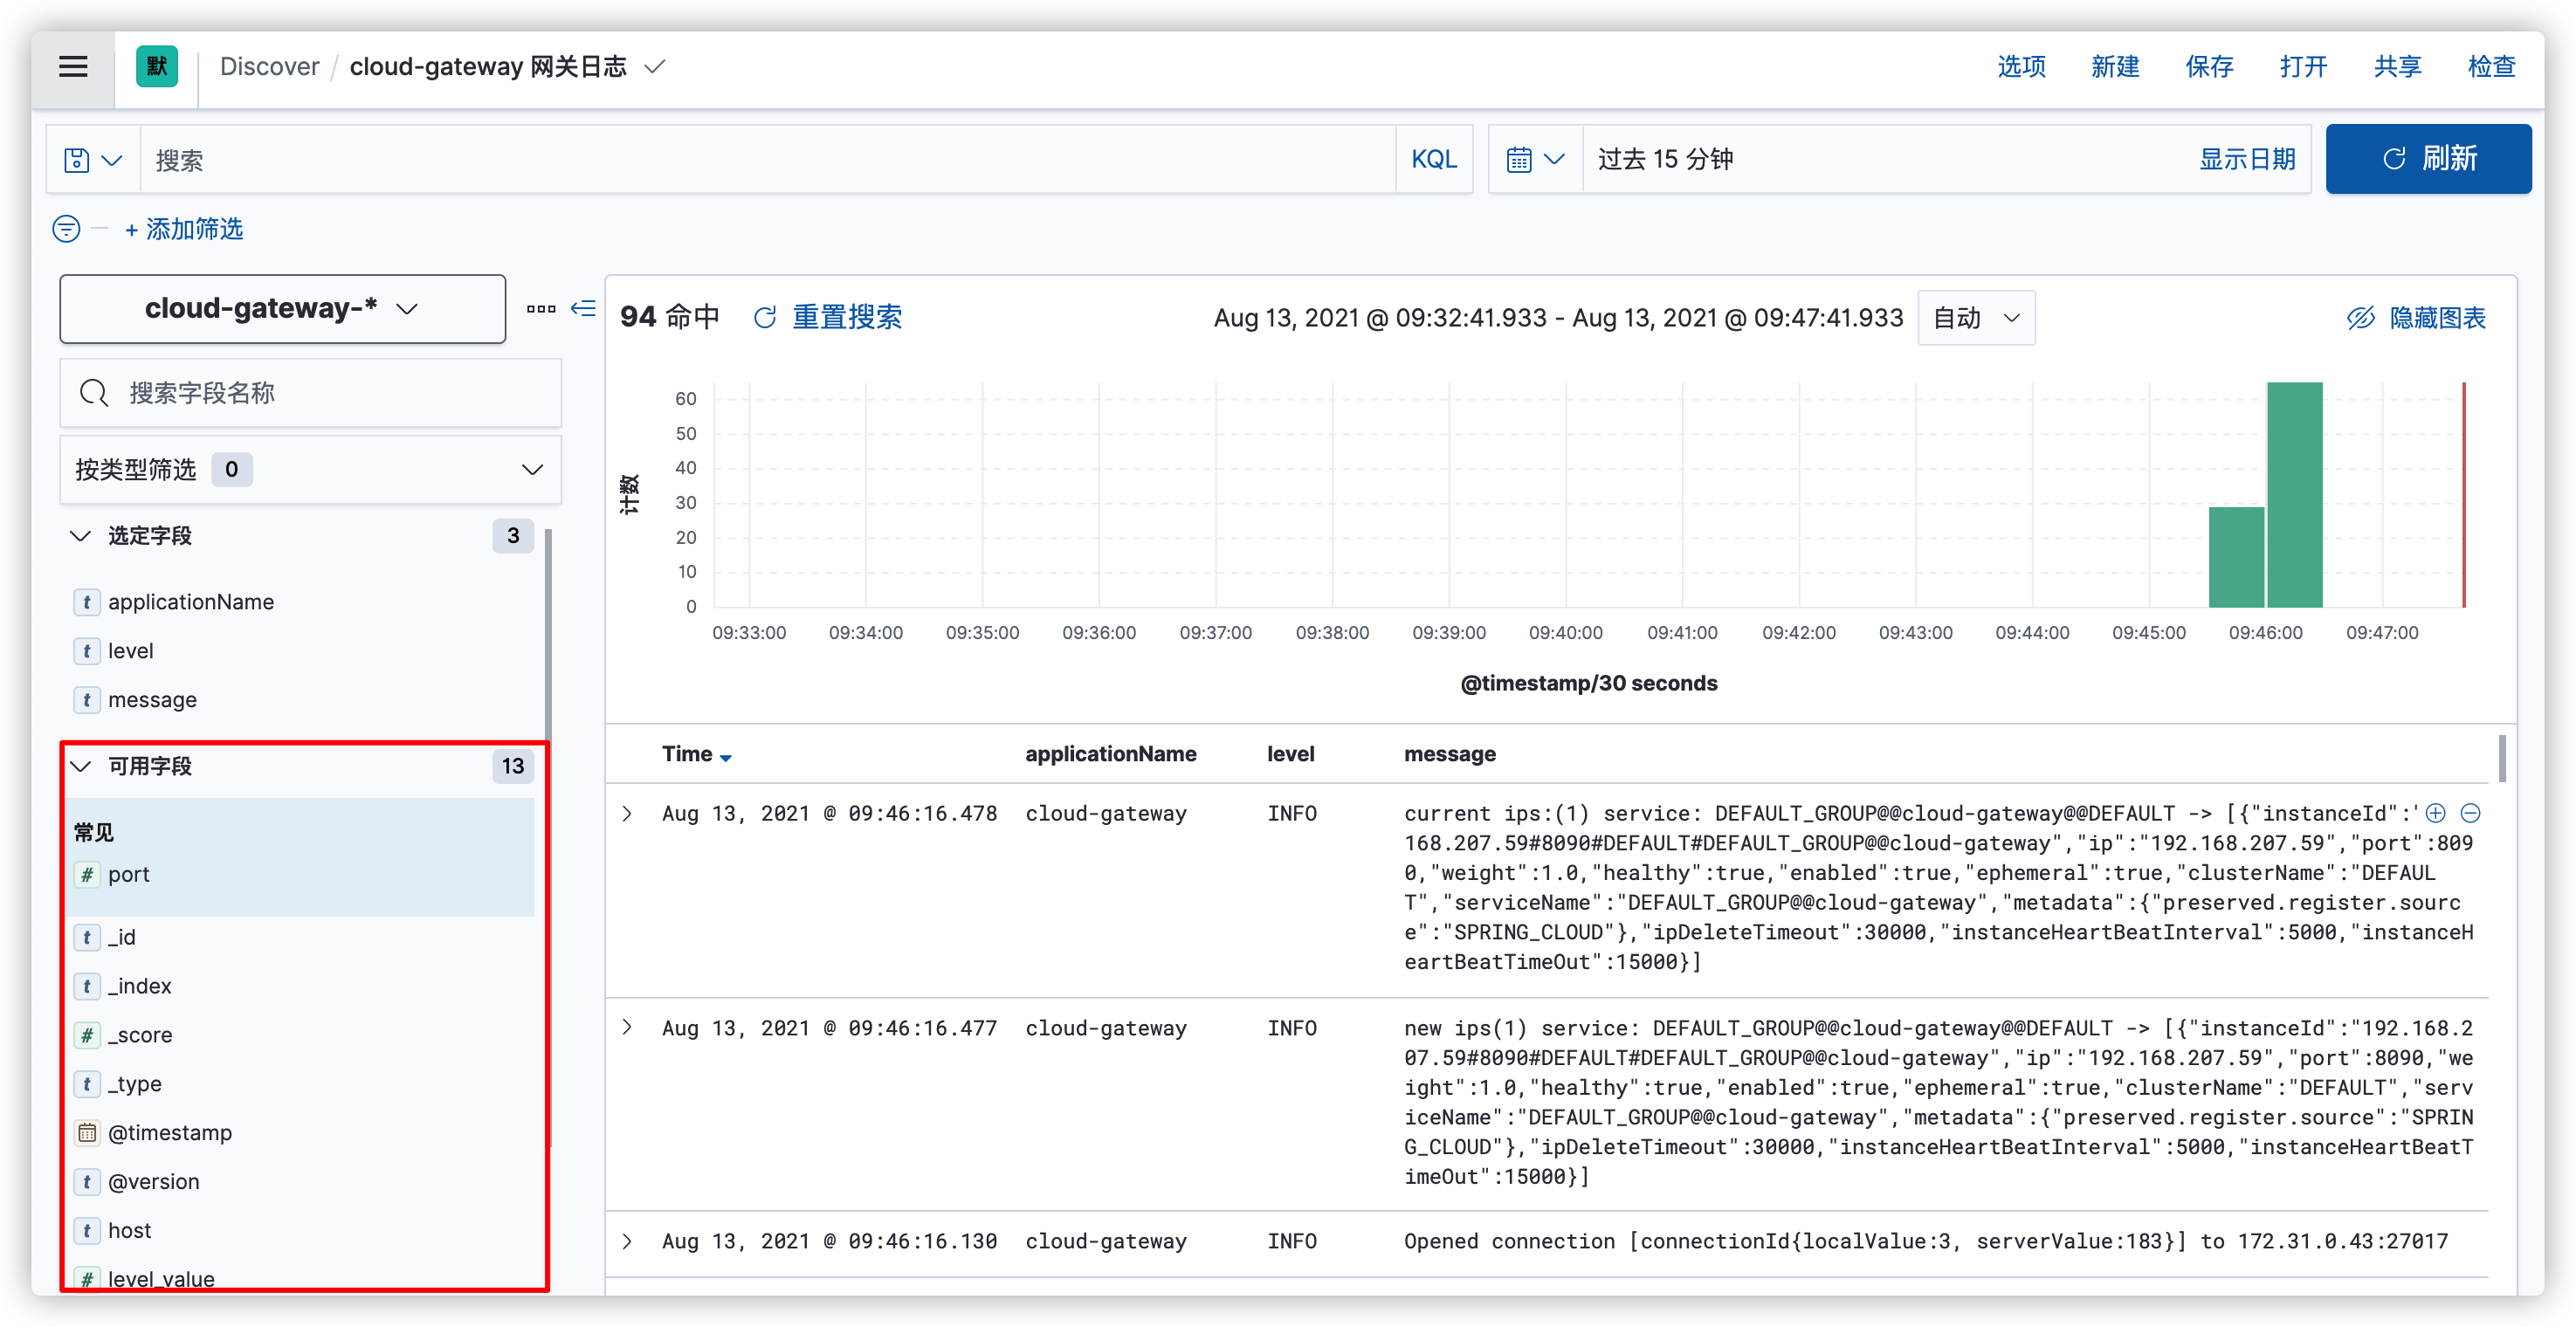
可以通过左侧添加对应的字段。
当然也可以流式传输实时查看日志
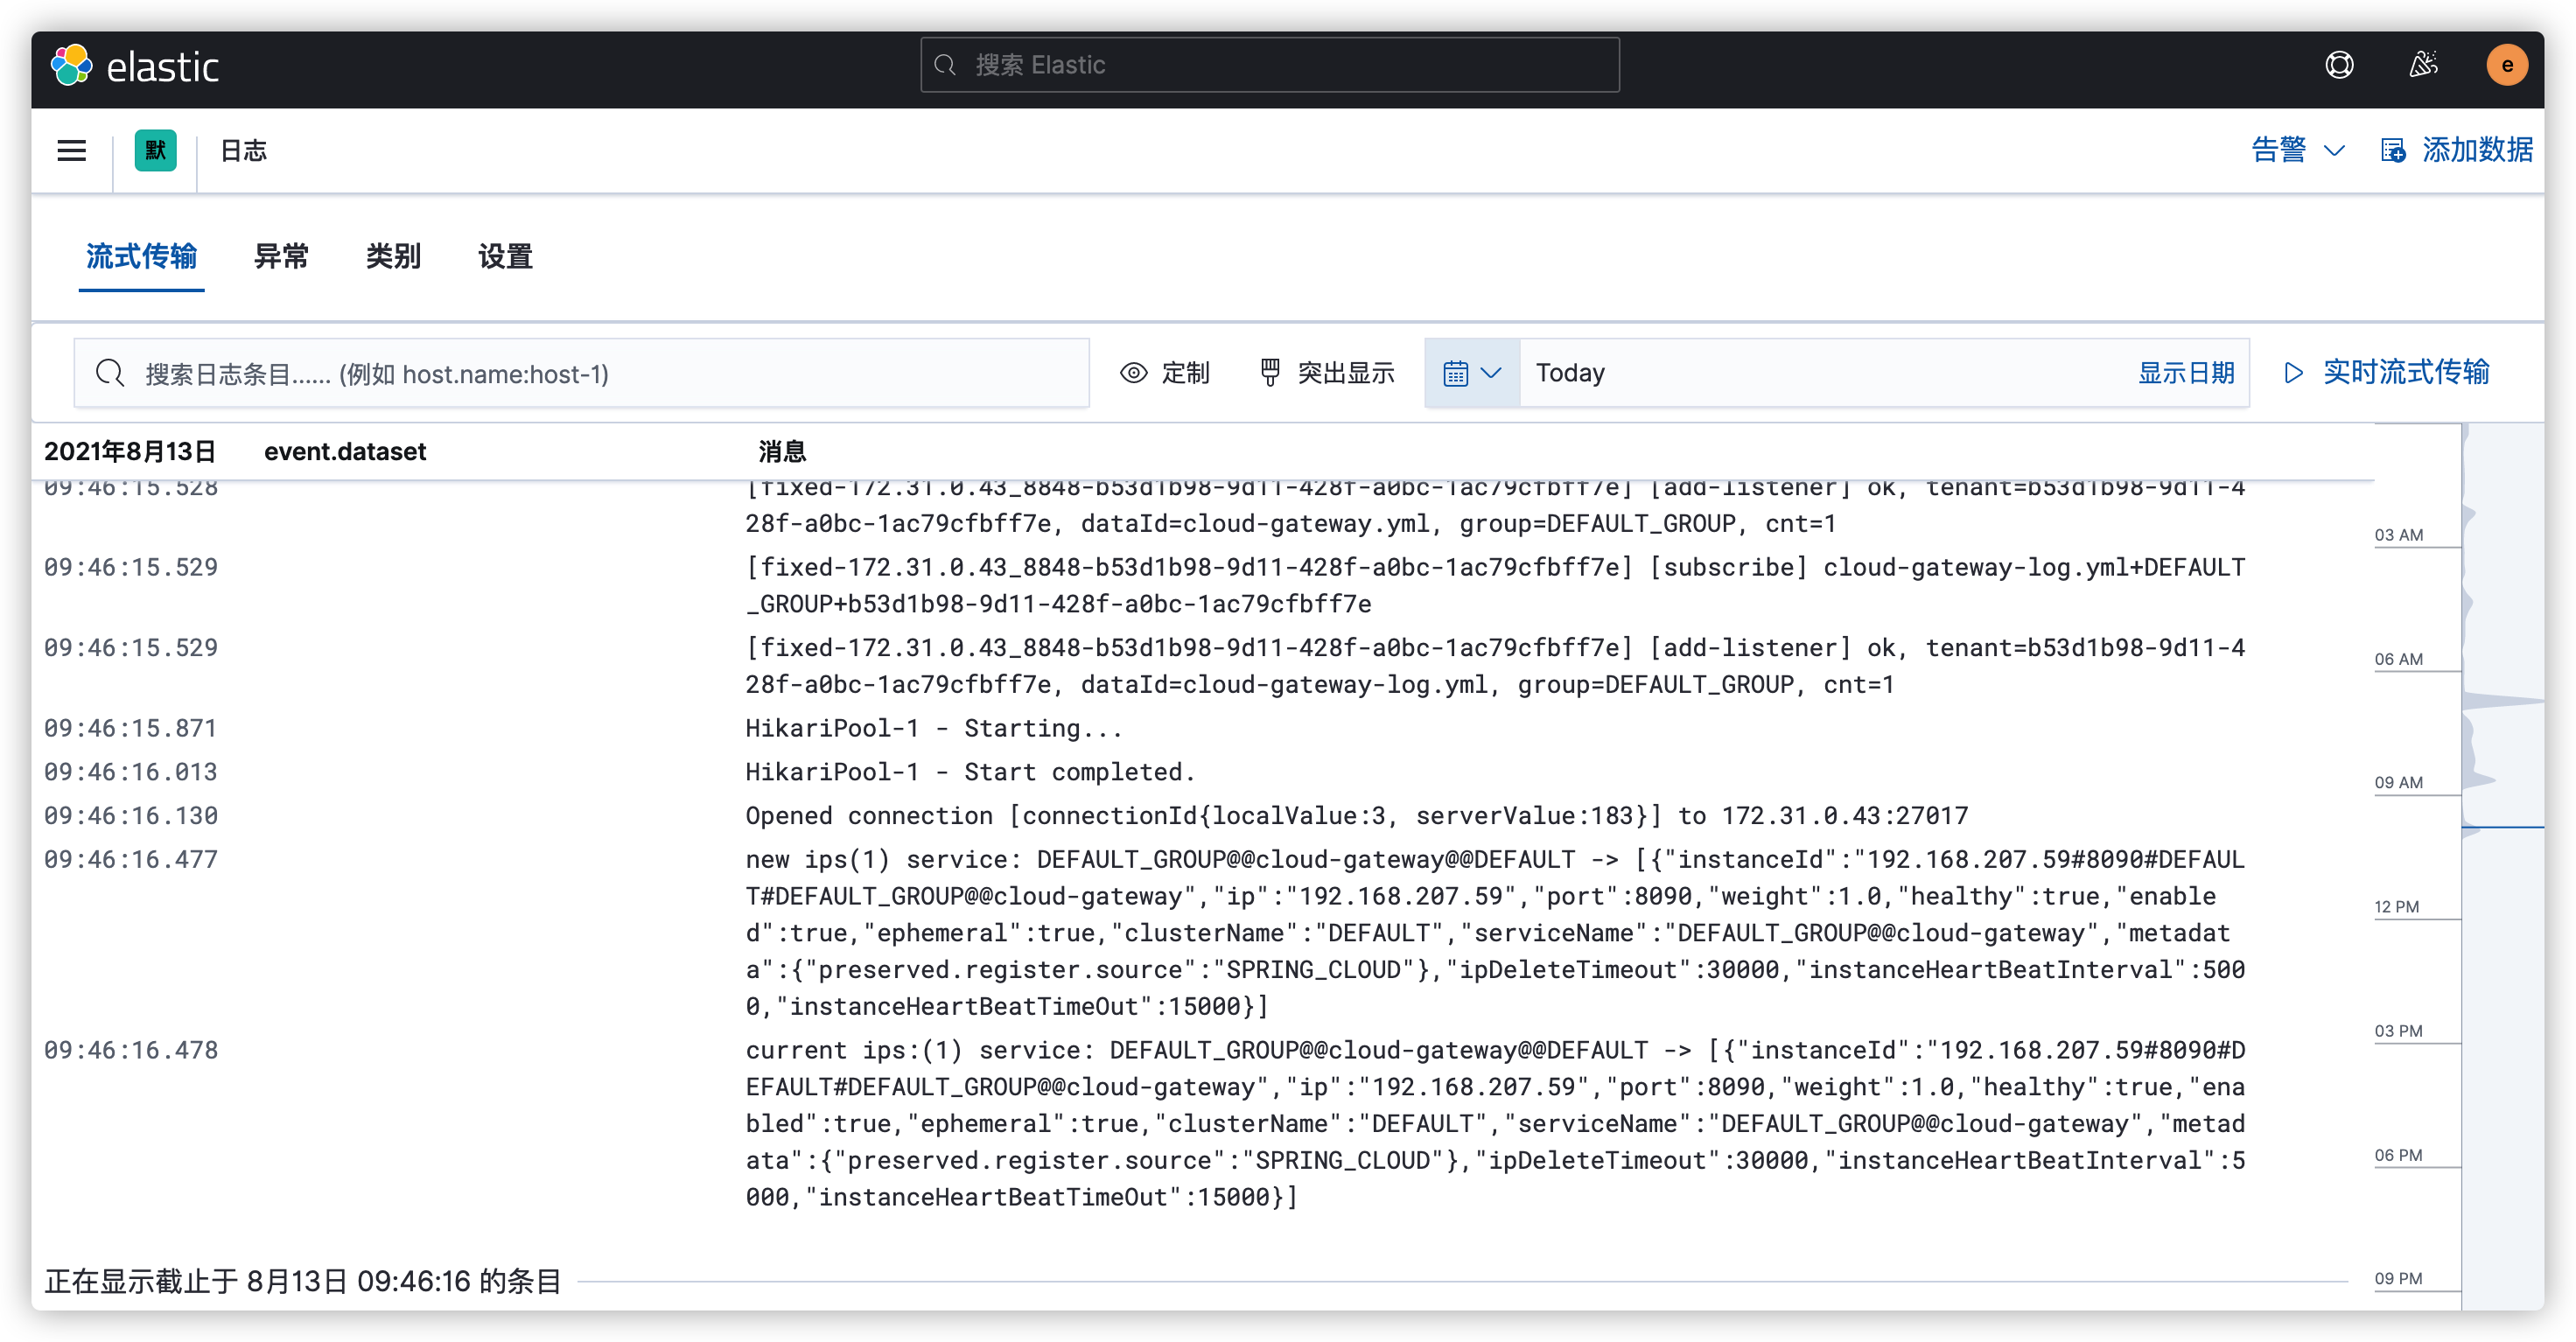
至于kibana的其他功能就需要各位自己去摸索了。
logback动态读取logstash的路径
上面我们配置logstash输出到elasticsearch的时候是直接写死了destination的配置
<destination>172.xx.0.xxx:5064</destination>那在实际开发的时候我们肯定不能这样,环境不同logstash的路径也不同,所以我们需要从nacos配置中心读取对应logstash的地址。
小提示,springboot读取配置文件是有优先级的,如果使用默认的logback.xml或者logback-spring.xml为配置文件名则会读取不到nacos上的配置,他会先于配置中心加载。所以我们这里需要使用自定义配置文件。
- 修改nacos配置中心service对应的配置文件,配置自定义日志名称以及logstash的路径
logging:
  config: classpath:logback-custom.xml

logstash:
destination: 172.xx.0.xxx:5064- 修改日志配置文件为
logback-custom.xml
- 在logback-custom.xml中定义常量,从配置中心读取配置,并修改
destination属性的值
<springProperty scope="context" name="logstashDestination" source="logstash.destination"/>
...
<destination>${logstashDestination}</destination>
通过上面三步操作,我们的logback就可以直接从nacos配置文件中加载logstash的相关配置了。
小结
ELK集中式日志是分布式架构中必不可少的一个组件,本文详细介绍了ELK基础环境的安装配置,希望对各位有所帮助。